Tuesday, May 26, 2015

Environmental Factors on a Game

A few months ago I did some research on how environmental factors effect how many runs are scored with Andrew Nave and Terrance McCabe, my classmates at SUNY Oneonta. We collected data from 100 games in the 2014 season. From these games we observed the number of runs scored, the temperature, location of the stadium, home or away, time of game, and ballpark size.

Our sample was collected by randomly selecting a number 1-30, each representing a different team, then randomly selecting a number 1-162, each representing a game played by that team. This data collection strategy gave us a very good representation of the population.

The first hypothesis we tested was whether more runs were scored at home or away. We predicted the same amount of runs are scored at home and away on average, to debunk the age old belief of home field advantage.  From our sample the mean (average) number of runs scored at home is 4.125 and the mean number of runs scored at away games is 4.047. In the nominal statistics teams do in fact score more runs at home, but after using a 2 sample T-test a p-value of .896 was yielded meaning that the two samples are practically identical. So the same amount of runs are scored at home and away. In baseball home field advantage is more of a long term advantage, where a team can build their team in a certain way. For example the New York Yankees signing left handed hitters due to the short distance to right field or the San Francisco Giants signing league average pitchers to pitch in their spacious ballpark to get above average ERAs.

Another belief about baseball games is that more runs are scored in the summer heat than in the cold. We tested the belief by splitting our sample into two categories, games where the starting game temperature was above 80 degrees and where the starting game temperature was below 80 degrees. Games with game time temperature of 80+ degrees had a mean of 4.138 runs and games with a temperature of less than 80 degrees had a mean of 4.071. Using a 2 sample T-test with the claim that more runs are scored during hot games, a p-value of .458 was the result. Since this is greater than the alpha value of 0.05 it is safe to say that from our sample the same amount of runs are scored in the heat and in the cold.

Often the west coast gets a bad reputation for its lack of runs scored because of the marine layer, but this is yet another theory we tried to debunk. By separating the sample into East, Central, and West we found that the means runs scored were 3.968, 4.023, 4.375 respectively. We tested the claim that the number of runs scored regardless of location are equal. By using an Analysis of Variance test (ANOVA test) we found a p-value of 0.858 which means there is not enough evidence to reject our claim. One may think that the runs scored are solely effected by the teams being better or worse than other teams, but the games that teams play on the road are also included in the sample.

Perhaps the most important find from our data collection was from the regression equation. Through backwards elimination we eliminated variables to find the best regression model. The variables that have the most effect on how many runs are scored in a game are time of game, elevation, and temperature. Where 0 represents day games and 1 represent night games

0: Runs = 1.27 + 0.0283 (Temp) +0.000678 (Elevation)
1: Runs = 1.96 + 0.0283 (Temp) + 0.000678 (Elevation)

Our regression analysis yielded an R^2 value of 10.47% which means that 10.47% of the runs scored in a game are solely attributed to the environmental factors mentioned above. In a 10 run game it is safe to say that 1 of the runs was scored because of the environment the team was playing in.

You can't predict baseball, but if you had to choose how many runs a team will score on a particular day the regression equation will be an decent estimate. The number of runs scored will most likely be around 4.

Monday, March 23, 2015

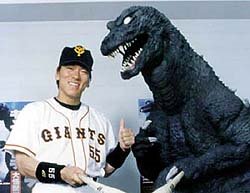
Hideki Matsui and the Rush for International Free Agents

The desire for international free agents has skyrocketed in the past few years. With better scouting more talents are being discovered and coming to the United States. Players have been coming to the United States from the Dominican Republic and Cuba for decades, but the desire for Japanese free agents started with the success Ichiro found in Seattle.

Undoubtedly the most successful Japanese player to make the transition to the MLB Ichrio sparked a period of high spending on international free agents. One player that often gets overlooked as a great success is Hideki Matsui.

Hideki Matsui
In 2003 Matsui signed a 3 year $21 Million contract with the New York Yankees, which today would be worth $26.67 Million. Over this 3 year period Matsui had an average annual WAR of 3.9 which is considered above value and above average. Also over that 3 year span Matsui actually played an average of 162.33 games.

Following his 3 year contract Matsui signed a 4 year $52 Million deal yielding an average annual value of $13 Million which is the modern day equivalent of a 4 year $66 Million contract. Over this span Matsui only played an average of 107 games with an average annual WAR of 2.2. He did not do as well in his last 4 years with the Yankees as he did in his first 3, but considering the value that international free agents are signing for today, the Matsui deal was a steal for the Yankees.

Yoenis Cespedes signed a 4 year $36 Million deal with the Oakland Athletics in 2012. Due to the slight change in CPI from 2012 to 2015 the nominal and real dollars of the deal are close to equal. The average annual value of the first 3 years of the Cespedes deal was $8.5 Million and his average annual WAR for those 3 years was 3.2, just less than Matsui, but at a similar average annual value.

Another international free agent who signed in 2012 was Yu Darvish who signed a 6 year $56 Million deal with the Texas Rangers, but over the first 3 years of the deal Darvish was paid $25 Million which yields an average annual value of $8.33 Million, but his average annual WAR was greater than both Cespedes and Matsui at 4.3 per season.

In 2014 international free agents began signing for much more. Part of this is due to a change in the posting system in Japan. Instead of the teams competing to post the highest bid to negotiate with a player, they can now post a max bid of $20 Million and all teams that posted the bid can negotiate with the player.

Masahiro Tanaka 
Masahiro Tanaka was a player that had teams post the max bid and ended up signing a 7 year $155 Million deal with Yankees. In his first season he had a WAR of 3.3 but at a much higher cost of an average annual value of $22 Million.

Also in 2014 Rusney Castillo a Cuban prospect signed a 7 year $72.5 Million with the Boston Red Sox. Castillo only played 10 games in 2014, but his average annual value is much higher than most other international prospects. The interesting part of the contract is the length. Castillo is only 27 years old and the Red Sox made a 7 year commitment just like the Yankees did with Tanaka, before either of them played a single game in the Major League.

Jose Abreu signed a 6 year $66.3 Million deal with the Chicago White Sox in 2014 and was paid $7 Million in 2014. His WAR for the 2014 season was 5.5 as he hit himself to a Rookie of the Year Award in an MVP caliber season. He had never played a game in the Major League prior to signing the contract, but the White Sox definitely got their bargain.        
Yoan Moncada 

Yoan Moncada is just 19 years old and he signed with the Red Sox with a signing bonus of $31.5 Million. The International free agent market is getting more competitive with more money being invested, players are signing at a younger age, and longer commitments being made to the players. The days were a team can sign an international free agent like Hideki Matsui for a contract similar to his initial 3 years $21 Million contract are gone. The risk involved in signing international free agents is higher than ever.


Sunday, December 7, 2014

Justin Upton

The Winter Meetings started today and the Braves' left fielder will definitely be a hot topic of discussion. The Braves already traded slick fielding outfielder Jason Heyward in a deal for Shelby Miller, but signed another great outfielder in Nick Markakis. Justin Upton's name has been fluttered around in trade discussions so far this off season. Many thought the Braves were in on the Yasmany Tomas sweepstakes and if they signed the Cuban slugger Justin Upton would be on the move. The Diamondbacks ended up signing Tomas, so now the question for the Braves is whether or not to trade Justin Upton.

Justin Upton will be a free agent after the 2015 season and will be just 28 years old next season. Upton was already traded once (by the Diamondbacks after the 2012 season), and the Braves definitely won the trade. Being one of the best young players in the game, Upton can fetch a large payout in a trade and will be in store for a large pay day whether it be through an extension or free agency.  

Since 2011 Upton has been constantly healthy playing in at least 149 games each season, and has hit for both power and average. His stolen base total has decrease dramatically since being traded to the Braves, but his other statistics have remained consistent except for strikeout percentage. In his final two seasons with the Diamondbacks Upton had a strikeout percentage of 19%. In the two seasons he has spent with the Braves his strikeout percentage has gone up to 26%, which means he is striking out on average once per game.

Besides the problem with the strike outs, Justin Upton can be very valuable to a team seeking a powerful bat. His slashline over the last three seasons is .271/.350/.462 equating to an OPS+ of 122. The Braves are very short on pitching, but they already traded one of their young outfielders, would they be willing to trade another? One theory that has been tossed around is using Evan Gattis in left field while letting catching prospect Christian Bethancourt get a chance behind the plate, but the Braves would definitely miss Upton's power.

Possible landing spots for Upton could be Seattle, Baltimore, San Francsico, and San Diego. The Braves will be seeking young pitchers who are ready or already established at a Major League level. The Mariners and Orioles have these pitchers in the form of Taijuan Walker, James Paxton, and Kevin Gausman. The only other outfield sluggers left on the market are Melky Cabrera, Matt Kemp,  Alex Rios, and a defensively challenged Micheal Morse. As more names come off the board, Upton will be in higher demand.
 

Saturday, December 6, 2014

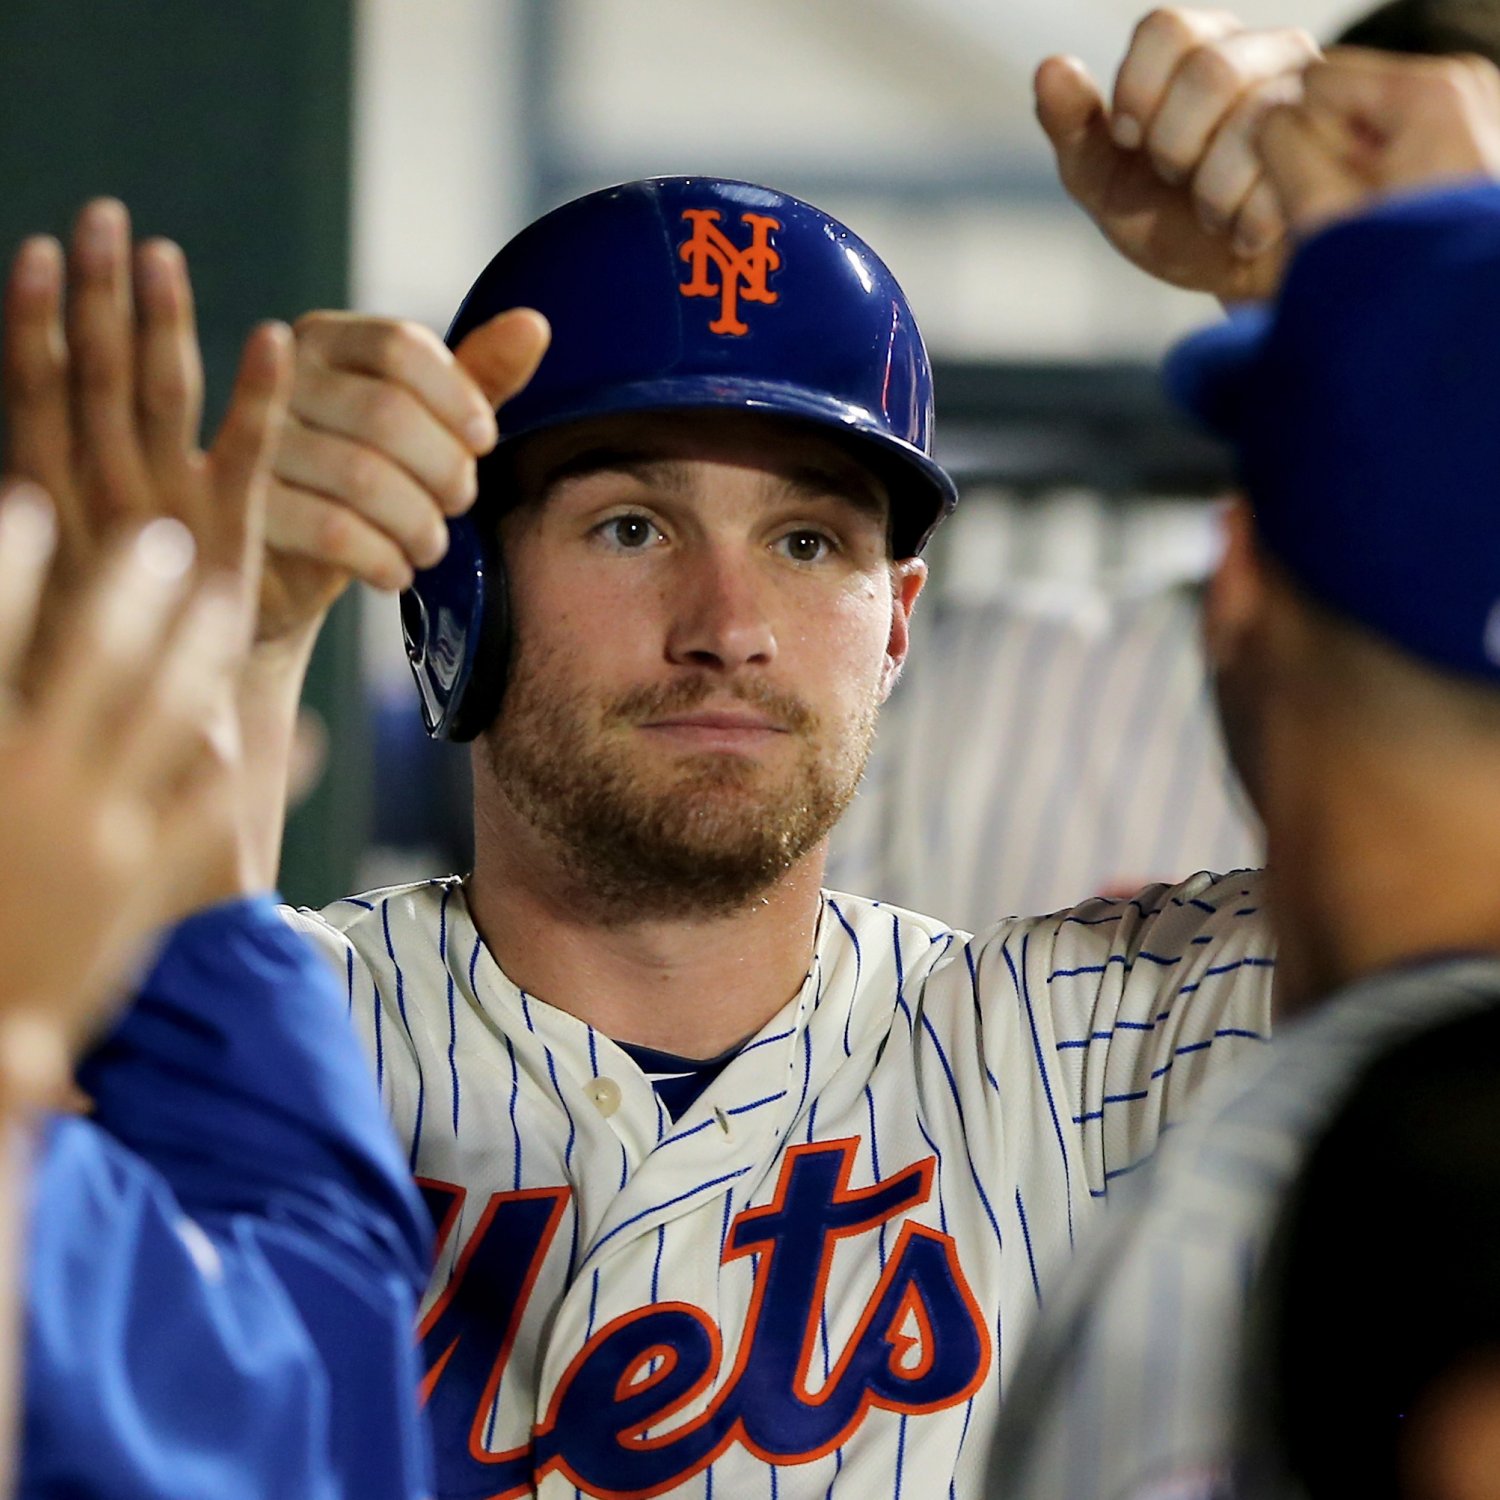
Player Profile: Daniel Murphy

Daniel Murphy played his way to his first All Star appearance in 2014, but he is underrated in many respects given his position. Murphy is a below average defensive second baseman, but his value comes with the fact that he can play multiple positions. In 2014 Murphy logged innings at third base and first base, and has experience playing left field. Daniel Murphy will never win and MVP and most likely will never win a gold glove award, but he can be a pivotal and important part of any team.

A comparable player to Daniel Murphy is Ben Zobrist, who is much more valuable than Murphy given the variety of positions and his high on base percentage he obtains every season and has much higher power numbers. Murphy is entering his age 30 season and his trade value may be higher than ever. He will be a free agent after the 2015 season so the Mets may be willing to trade him.

An important aspect of the game for non power hitting players is strikeout rate. Over the course of the past four seasons, Murphy has struck out just 12.8% of the time. Over the course of the last three seasons Murphy has played an average of 153 games, showing that he can remain healthy for an entire season and stay consistent. Over that same span of three seasons he posted a .288/.327/.407 slashline equating to a 107 OPS+. He can hit for some power (Average of 9 home runs and 38 doubles per season) and can swipe a few bags (Average of 15 per season). He reached career highs in home runs and stolen bases in 2013 when he hit 13 and swiped 23 respectively.

Daniel Murphy would make a lot of sense for a lot of different teams. Second base is a position that lacks good hitters. Although it is headlined by names like Robinson Cano, Jose Altuve, and Ian Kinsler, only about a third of the league has an OPS over .700. Competing teams like the Orioles, Blue Jays, and Diamondbacks may be interested in Murphy's services.

Tuesday, September 30, 2014

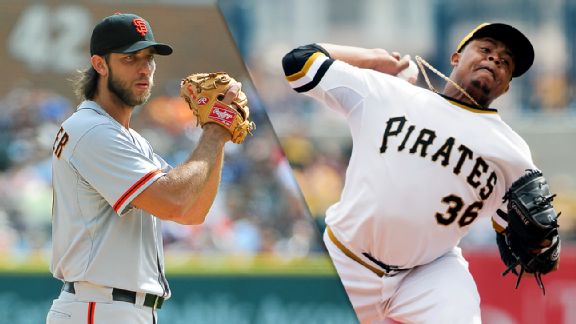
Giants vs Pirates

Using the WAR ratio I used for the Oakland vs Kansas City game the Giants appear to have a slight advantage.

Giants offense has a WAR of 19.7
Pirates offense has a WAR of 29.5

Madison Bumgarner has a WAR of 4.0
Edison Volquez has a WAR of 2.5

That give the Giants a ratio of .135 and the Pirates a ratio of .126.

Monday, September 29, 2014

Playoff Predictions

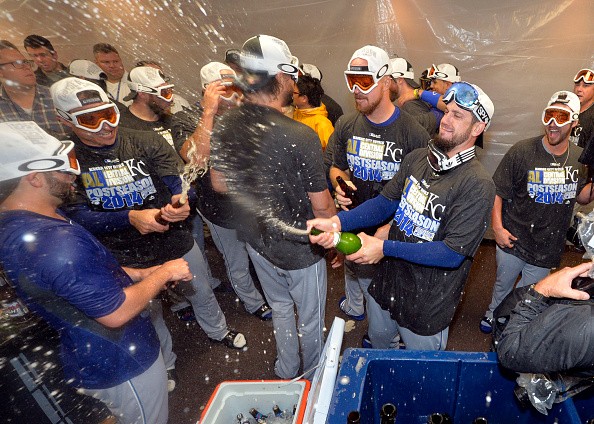
Royals make the playoffs for the first time in over 20 years
I may say some contradictory things on this website, that is because I try to quantify things. I like to assign a number to every thing in the game, but sometimes that is not possible. So my playoff predictions may differ from some mathematical interpretations I post on here. Here are my playoff predictions for 2014.

Nationals take the World Series over the Orioles

Oakland vs Kansas City

It has been a pretty long time since I made a post and a lot of stuff has happened, but a new statistical though has brought me back. So here is my latest thought on how to predict playoff games correctly.

This goes back to the idea of Pitching Performance Value, but this time evaluated with WAR. PPV would evaluate a pitcher's performance after they have pitched. This new stat will make a prediction of the game winner before the game starts.

Former AL East rivals will go head to head tomorrow
So if an average pitcher pitches against an average lineup and an above average pitcher pitches against an above average lineup the box score is likely to appear the same. For example if Wei Yin Chen and Sonny Gray were to go head to head the box score may look the same. Wei Yin Chen (Orioles) is an average pitcher against an average lineup and Sonny Gray (Athletics) is an above average pitcher against an above average lineup.

To figure out who might win this game we will look at a ratio of the pitcher's WAR and the offense's WAR as a whole. So take the WAR of the starter and divide by the summation of the WAR of the opposing lineup. Do this for both pitchers and lineups and the greater value is the pitcher who will win. So lets do this for tomorrows game between the Athletics and Royals

The Royals lineup has a WAR of 18.3 and the Athletics lineup has a WAR of 21.3. Jon Lester (Athletics) has a WAR of 4.8 and James Sheilds has a WAR of 3.4.

Royals Ratio = 3.4/ 21.3 = 0.15
Athletics Ratio = 4.8/18.3 = 0.26

The Athletics will win the game tomorrow. It is hard to say what the final score will be, but according to the overall talent of the players and pitchers Oakland has an absolute advantage. Baseball is unpredictable but i'm just trying to quantify it.