Showing posts with label National League. Show all posts

Tuesday, June 3, 2014

National League All Star Game Selection

The National League seems like the dominant league this All Star Game with several producing players at each position. Below are my top two picks for each position. I will also give 2 bonus picks because there is no DH for the National League, but there will be in the All Star Game.
Jonathon Lucroy

Catcher:
Jonathon Lucroy - Milwaukee Brewers - .325/.394/.483
Yadier Molina - St. Louis Cardinals - .305/.349/.442

First Base:
Paul Goldschmitt - Arizona Diamondbacks - .299/.354/.521
Matt Adams - St. Louis Cardinals - .325/.337/.474

Second Base:
Troy Tulowitzki
Chase Utley - Philadelphia Phillies - .319/.378/.517
Dee Gordon - Los Angeles Dodgers .280/.331/.372

Third Base:
David Wright - New York Mets .296/.345/.403
Nolan Arenado - Colorado Rockies .305/.333/.409

Shortstop:
Troy Tulowitzki - Colorado Rockies .350/.450/.661
Hanley Ramirez - Los Angeles Dodgers .261/.336/.469

Outfield 1:
Giancarlo Stanton - Miami Marlins  .313/.411/.611
Andrew McCutchen
Carlos Gomez - Miluakee Brewers .312/.388/.566

Outfield 2:
Yasiel Puig - Los Angeles Dodgers .340/.430/.606
Justin Upton - Atlanta Braves - .301/.380/.575

Outfield 3:
Andrew McCutchen - Pittsburgh Pirates .304/.425/.469
Seth Smith - San Diego Padres .310/.419/.548

Bonus Players:
Michael Morse - San Francisco Giants .298/.371/.574
Freddie Freeman - Atlanta Braves .297/.388/.512

The pitchers will be chosen by St. Louis Cardinals manager Mike Matheny because they won the National League Pennant. These are my picks for the pitchers.

Johnny Cueto 
Starting Pitchers:
Johnny Cueto - Cincinnati Reds - 1.68 ERA 92 k
Tim Hudson - San Francisco Giants 1.75 ERA 50 k
Julio Teheran - Atlanta Braves 1.83 ERA 66 k
Adam Wainwright - St. Louis Cardinals 2.32 ERA 81 k
Zack Greinke - Los Angeles Dodgers 2.50 ERA 83 k
Micheal Wacha - St Louis Cardinals 2.45 ERA 75 k
Jeff Samardjiza - Chicago Cubs 2.54 ERA 67 k
Clayton Kershaw - Los Angeles Dodgers 3.32 ERA 55 k
Stephen Strasburg - Washington Nationals 3.15 90

Relief Pitchers:
Huston Street
Kenley Jansen - Los Angeles Dodgers 3.60 ERA 42 k
Francisco Rodriguez Milwaukee Brewers 2.33 ERA 41 k
Sergio Romo - San Francisco Giants 3.52 ERA 19 k
Huston Street - San Diego Padres 1.23 ERA 24 k
Craig Kimbrel - Atlanta Braves 1.77 ERA 37 k
Jonathon Papelbon - Philadelphia Phillies 1.91 ERA 19 k
Aroldis Chapman - Cincinnati
Reds 1.80 ERA 18 k


Monday, December 23, 2013

About Me And Recent Work

I hope you all are enjoying the holiday season, as this is when the market slows down. I would like to take a moment and let my readers know a little about me. My goal is to one day be a general manager of a Major League team, but I would be just as happy to work for a network that broadcast baseball, or another position for a team. I have also considered opportunities that may exist in Japan, Australia, The Dominican Republic, and other foreign countries. I am currently studying statistics, economics, and mathematics in hopes to earn my bachelors degree in a few years. 

In my intro to statistic class, my group and I look at some distinct groups in the Major Leagues. We collected data from all the position players who played 116 games or more in 2013 and stratified them into groups: 50 American League players, 50 National League Players, 33 24-27 year old players, 34 28-31 year old players, and 33 32-35 year old players. 


Using statistical software and proper judgement we found that there is not much evidence that proves that one group is better than the other in home runs. This chart to the right shows the home runs for the 50 players in each league who played at least 116 games. The evidence shows that the American League is not better than the National League as many think, they are literally almost exactly the same.  The same outcome came up when comparing the number of home runs by the different age groups. The American League is only superior in one respect: the pitcher is not required to bat, but I did not incorporate that, I strictly wanted to test the players. 

Batting average also doesn't change much between age group as many think. It is a common misconception that the 28-31 age group is the best age group, but in batting average they all seem to be the same. In this graph 0 represents the other two age groups, and 1 represents the 28-31 age group. They are statistically similar. A player may be healthiest and most agile when in this age group, but in 2013 all of the players seem to have similar statistics. 

Remember that each age group was composed of about 33 players randomly selected from the total number of players in that age group who played 116 games or more. One notable player that was not selected randomly was Miguel Caberea. Perhaps after another selection the statistics may be slightly more different, but not by much. 


Wednesday, July 11, 2012

Memorable Moments From the 2012 All Star Game

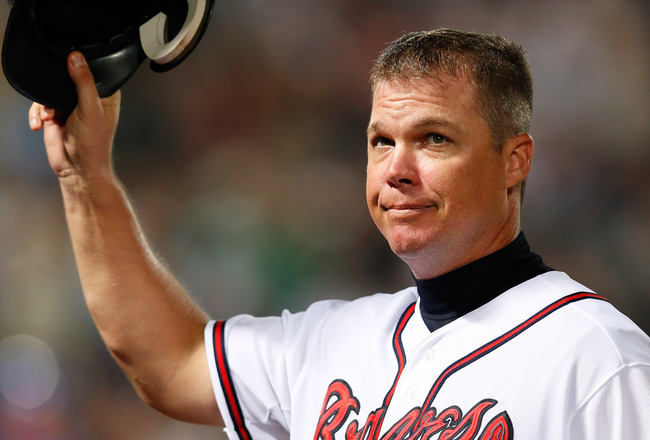
Chipper Jones started the game with an unprepared speech to the National League All Stars. He stated that no matter how well, how bad, how old, or how young just enjoy the game because you deserve to be there. The future Hall of Fame candidate also said this is his last All Star Game and he is not going to lose.

In the first inning the National League pounded Justin Verlander and put 5 runs on the board. The big blow came off of a bases clearing triple by Pablo Sandoval. The irony is many people said David Wright deserved the start instead of Sandoval. 3 triples total were hit by the National League, one by Sandoval, Furcal, and Braun.

Melky Cabrera hit the only home run of the game and earned him the MVP of the game. It was just another thing to add on to an already great season.

Chipper Jones had one at bat in the game and was able to make the most out of his at bat. He got a single through the 3.5 hole. His final All Star Game was worth it. His speech probably made a big impact on the players and they won this game for him.

The final score was 8-0 in favor of the National League. The National League team in the World Series will now have home field advantage. This is also the third consecutive year the National League has won the All Star Game.

Thursday, March 1, 2012

2012 Standings Predictions

The standings are ordered from the team with the most wins to the team with the least wins. The teams will be listed with the number of wins following. All of the wins are approximates, the actual number may vary 1-2 wins higher or lower depending on unexpected events during the season.  The teams with a "W" following their name means they will get a wild card spot. 

American League

East 
        1. Yankees 98
        2. Red Sox 93 W
        3. Rays 90
        4. Blue Jays 70
        5. Orioles 62 

Central 
        1. Tigers 95
        2. Indians 83
        3. Royals 81
        4. Twins 70
        5. White Sox 70 
 
West
        1. Rangers 94
        2. Angels 93 W
        3. Mariners 71
        4. Athletics 64

Nationals League

East
        1. Phillies 96
        2.Marlins 92 W
        3. Nationals 87 
        4. Braves 85
        5. Mets 63

Central 
        1. Reds 93
        2. Cardinals 92 W
        3. Brewers 85
        4. Pirates 78
        5. Cubs 65
        6. Astros 60

West 
        1. Giants 91*
        2. Diamondbacks 91*
        3. Dodgers 85
        4. Rockies 73
        5. Padres 60 

* The Giants and The Diamondbacks are so well matched they will finish with exact records. They will have to play a game 163 and the winner will go on and win the division. I predict the winner of game 163 to be the Giants.